
Analyzing Campaign Results
Prisma provides two ways to look at campaign performance: directly in the app through the Analysis section, and by exporting raw data to work with outside Prisma.
Dashboard
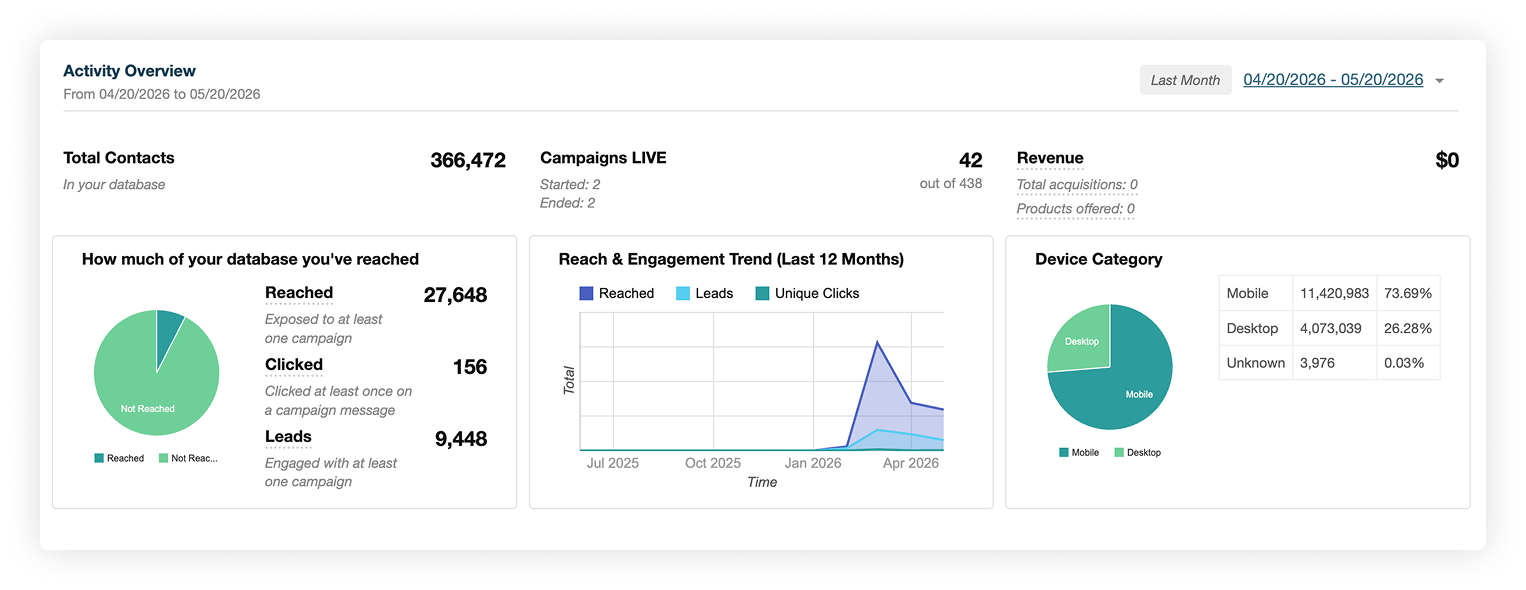
When you open Analysis, the first thing you see is the Dashboard — a high-level summary of all campaign activity: total customers reached, clicks, leads, live campaigns, and revenue data across the selected time period.
In-app analysis
Go to Analysis in the main navigation. You’ll find two main views:
Inbound
Shows activity from campaigns where the customer initiated the interaction — for example, clicking a banner on your website or app. Metrics here include:
- Reached — how many times a campaign was shown to a customer
- Engaged — how many customers opened the message (for email campaigns, this is the email open count)
- Leads — customers who progressed further into the funnel after engaging
- Converted — customers who completed the campaign goal
- Dismissed — customers who explicitly closed the campaign without engaging
Outbound
Shows results for email, SMS, and push notification sends. Filter by channel to isolate the data you need:
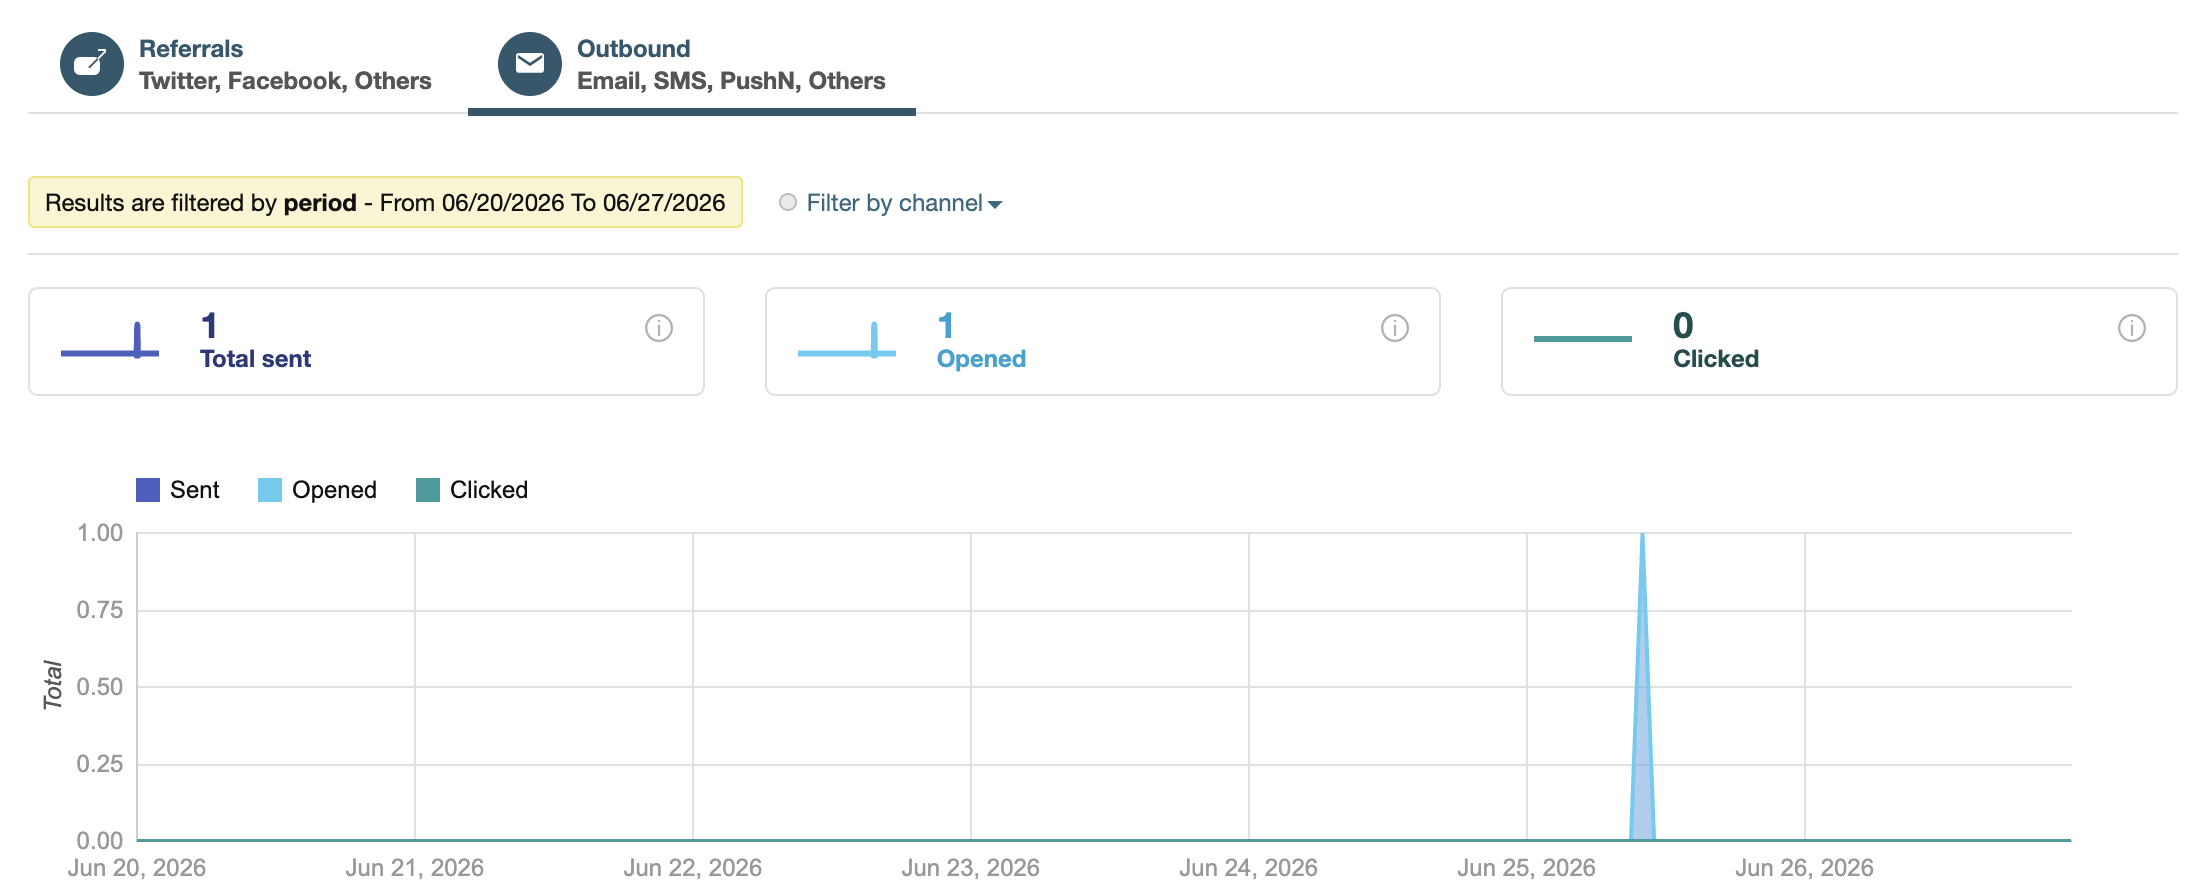
Metrics include:
- Sent — total messages dispatched
- Delivered — messages confirmed as received by the provider
- Opened — unique customers who opened the message
- Clicked — unique customers who clicked a link inside the message
- Bounced — messages that could not be delivered
Select a campaign from the list to see its individual blasts, each with open rate and a View Content link to preview the exact message sent:
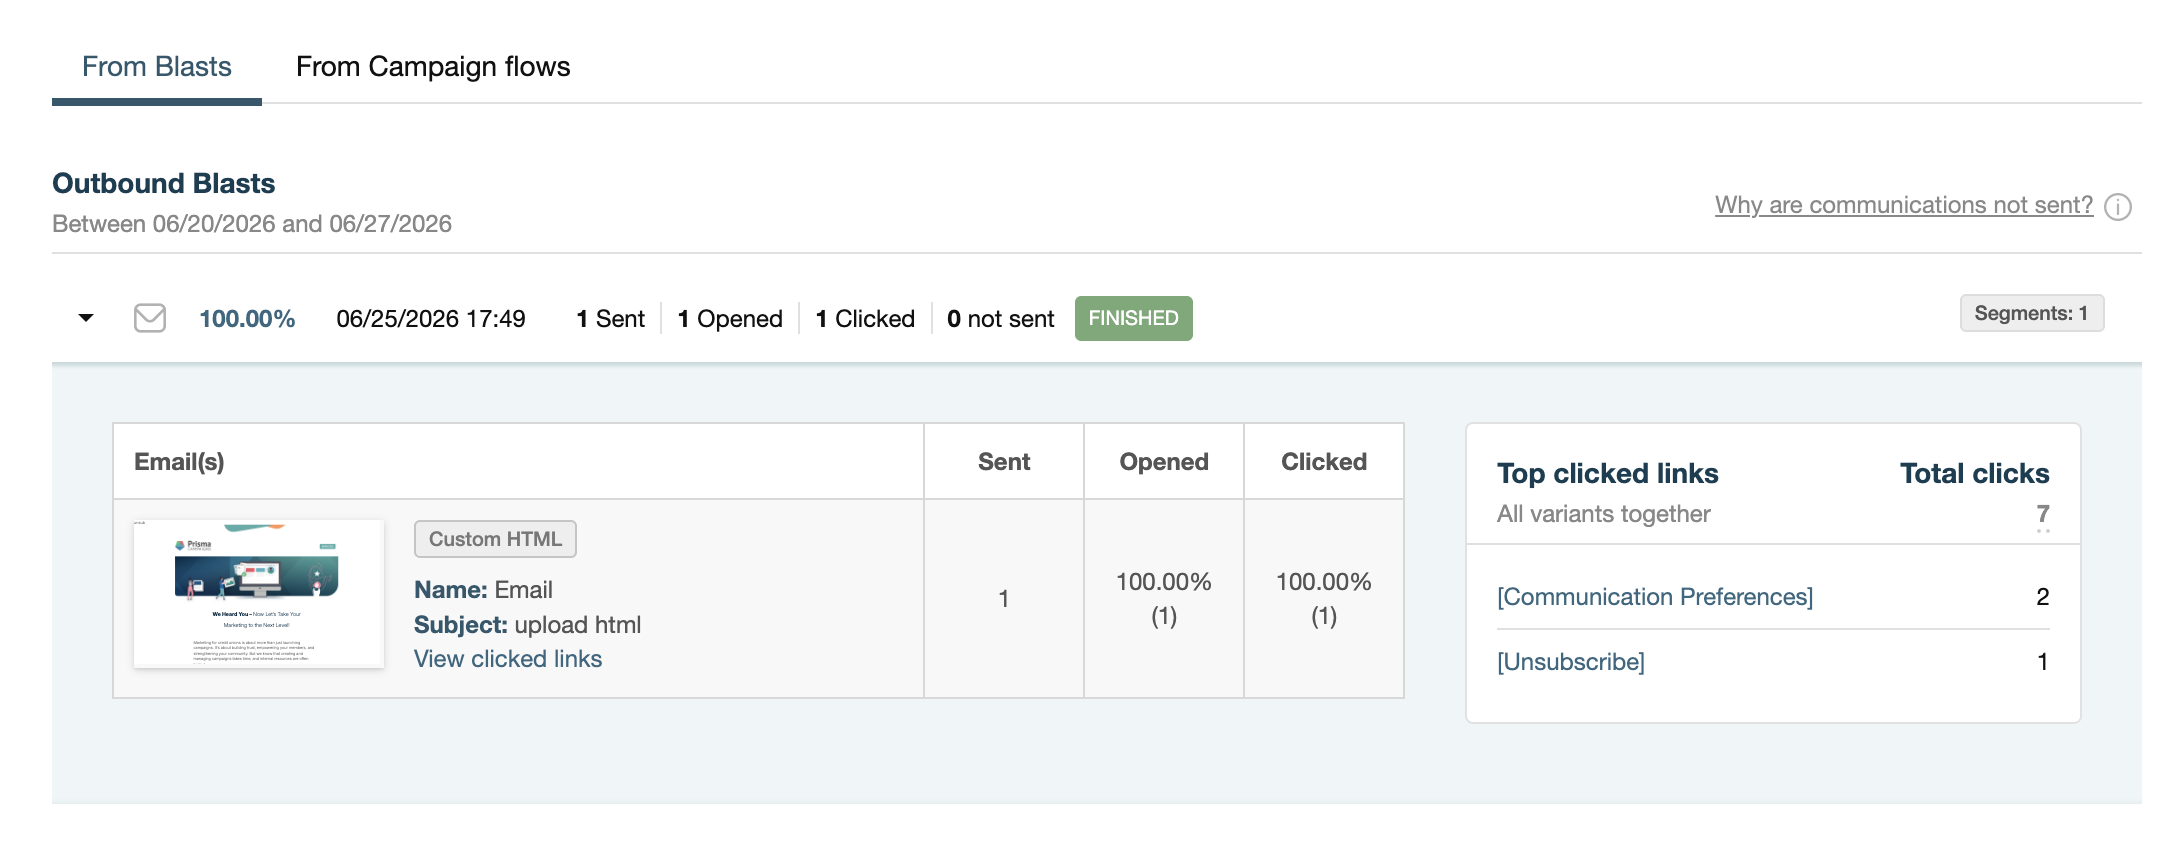
Each blast shows the same metrics broken down for that specific send, and you can click into a blast to preview the exact message that was delivered.
Opened and clicked counts are unique per customer per blast. If the same customer opens an email five times, it still counts as one open.
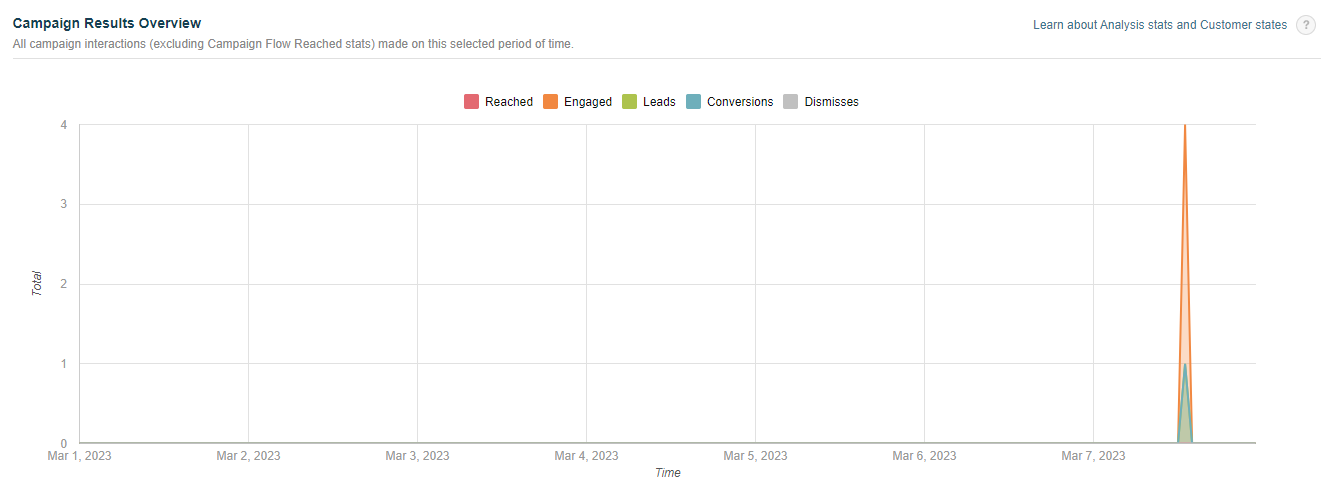
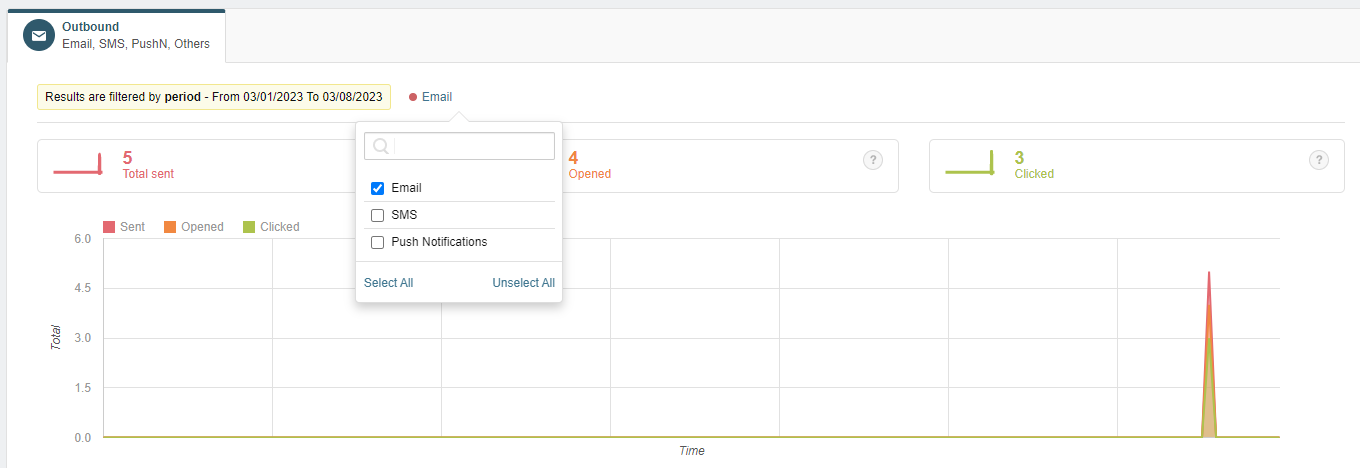
The results view also shows color-coded customer activity metrics over a time interval with toggleable categories:
For outbound channel analysis, filter by channel to see per-channel statistics:
Campaign Flows analysis
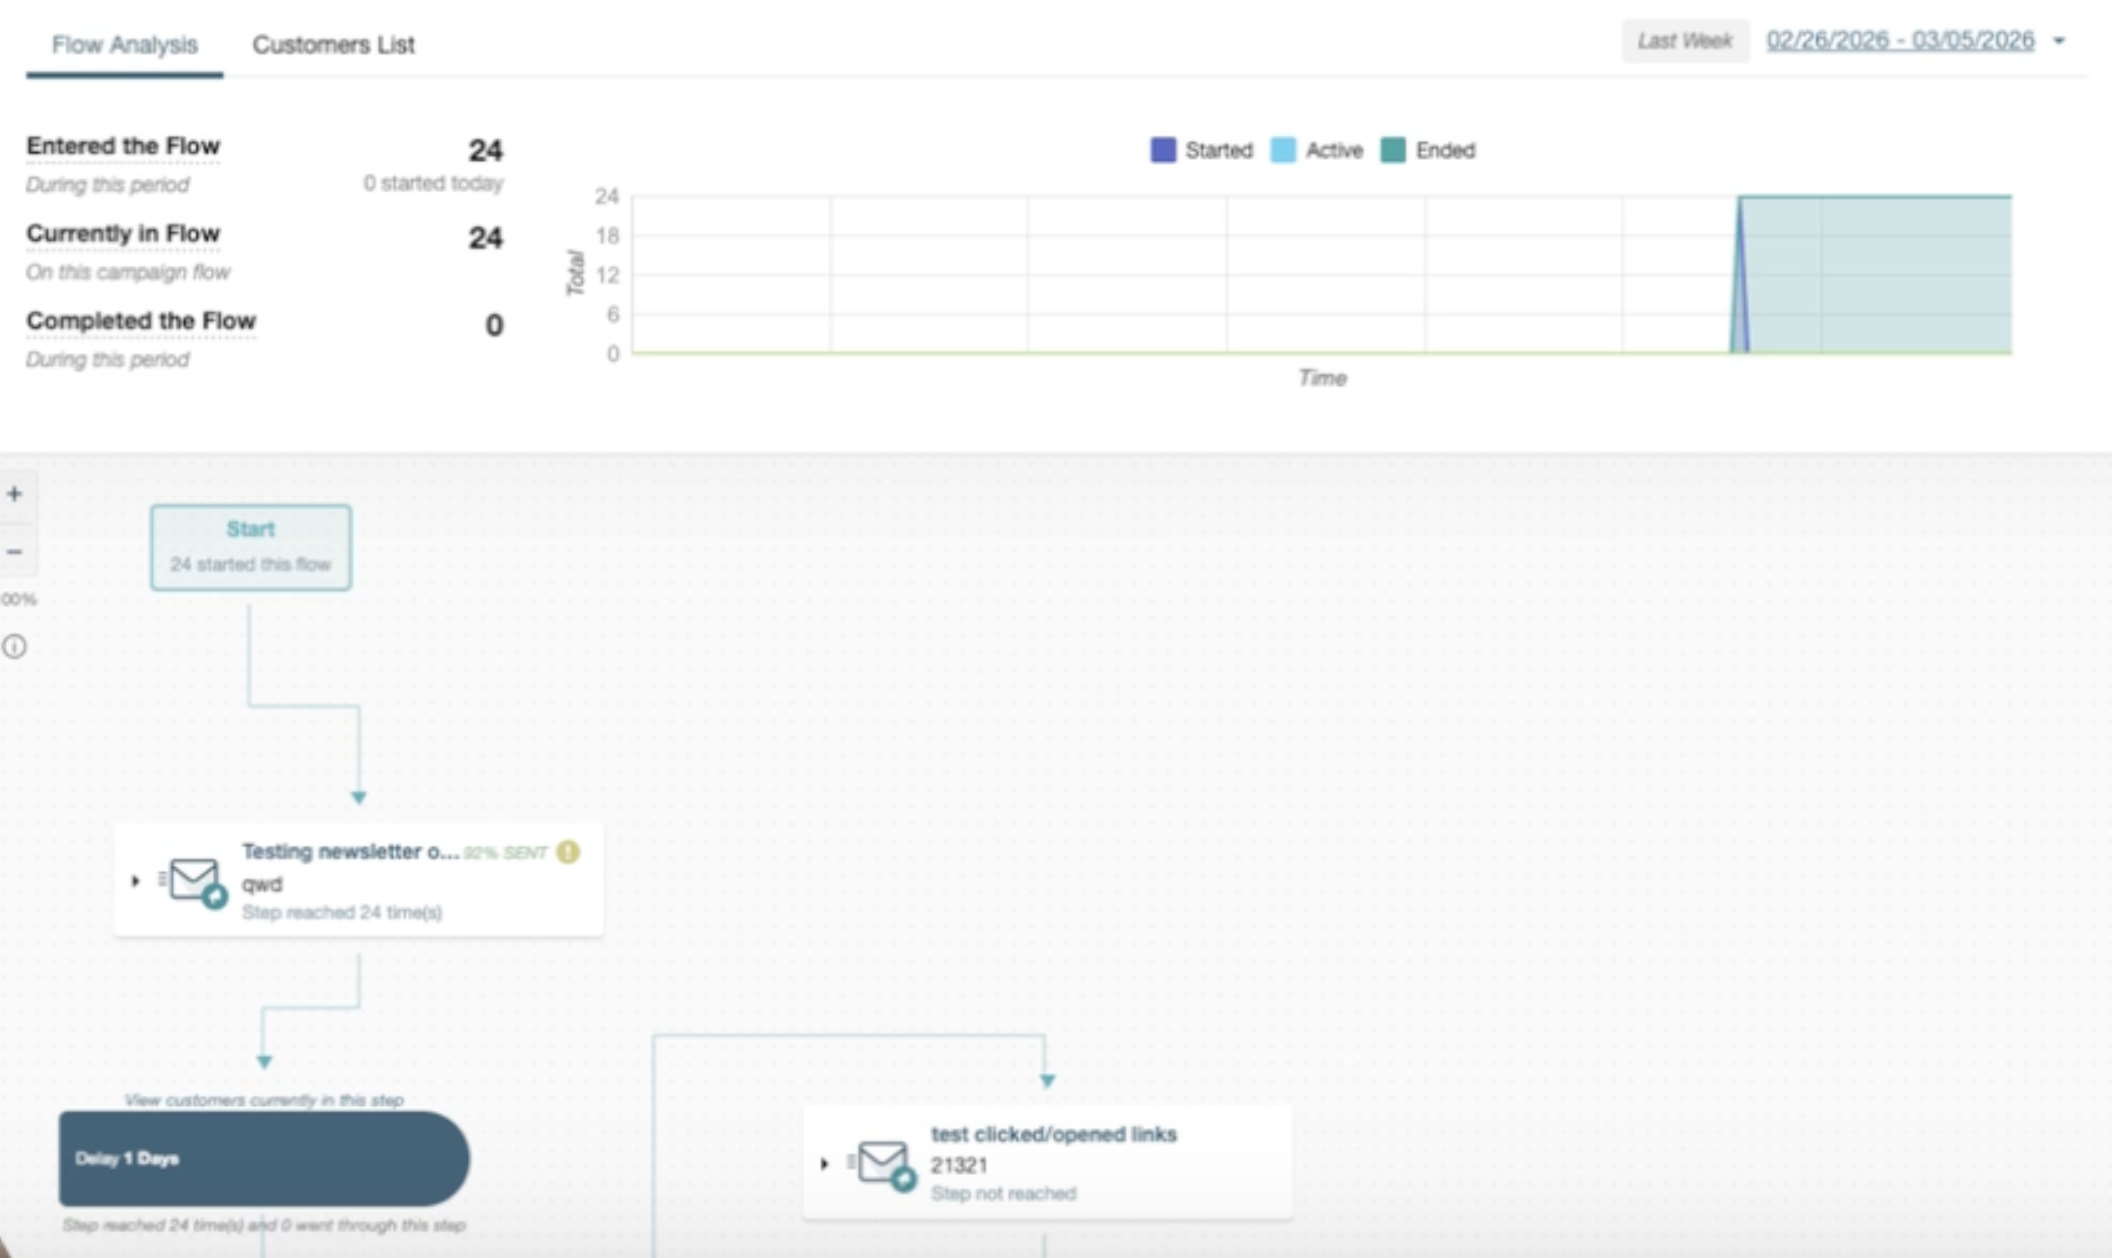
Campaign Flows have their own analysis tab showing a visual representation of the flow, metrics per step, and the list of customers currently at each step:
Filtering by date and channel
Both views can be filtered by date range and by channel (email, SMS, push). Use the channel filter to isolate email performance from push performance when a campaign uses multiple channels.
Exporting data
For deeper analysis or reporting in external tools, you can export campaign data to CSV.
From any campaign’s Analysis view, click Export. The export includes the full list of customers who were contacted, their contact status (sent, opened, clicked, bounced), and timestamps. To control which fields and events are included in the export, configure the campaign’s Conversion tab before exporting.
The in-app stats and the export may show slightly different numbers in some cases. The in-app view aggregates data in real time; the export reflects the raw event log. For an explanation of the difference, see Why Do In-App Stats and Exports Differ?
Individual customer tracking
While the Analysis section shows aggregate data across all customers, you can also trace exactly what happened for a specific person. Open any customer from the customer list and go to the Journey tab.
The Journey tab shows a chronological history of every interaction Prisma has recorded for that customer: campaigns they entered, messages they received, links they clicked, funnel steps they completed, and conversions. This is the right place to investigate why a specific customer did or did not receive a communication, or to verify that a campaign is working correctly for an individual case.
The Active Campaigns tab on the same profile lists which campaigns the customer is currently enrolled in — useful for understanding unexpected messaging behavior or checking whether a customer is being held back by a communication policy.
What to look at first
When reviewing a new campaign’s results, start with:
- Delivery rate — if this is low, check your contact field configuration in Channels and verify that customer records have valid addresses
- Open rate — a low open rate usually points to subject line or send timing issues
- Click rate — measures how compelling the message content is
- Conversion rate — the ultimate measure of whether the campaign achieved its goal
 Related Articles
Was this article helpful?
On this page